NWEA MAP Math Test: Scores, Topics, and Practice
The NWEA MAP Growth Math test is a computer-adaptive school assessment that measures your child’s current mathematics achievement and academic growth over time.
The test can include questions below, at, and above your child’s grade level. This is intentional. MAP Growth adjusts the difficulty as your child answers so that the assessment can estimate what they understand and which skills they may be ready to learn next.
This guide explains how MAP Math works, which topics may appear, what the RIT score means, and how you can help your child prepare. It also includes independently created practice questions for students from kindergarten through eighth grade.
Last updated: July 2026
Primary sources: NWEA MAP Growth product information, family guidance, testing-duration research, and 2025 MAP Growth norms resources.
Optional TestPrep-Online preparation:
When your school permits practice, families can review TestPrep-Online MAP practice, MAP Shop and TestPrep-Online Family Membership. Confirm the assessment, grade or level, current pack contents, access terms, and school policy before purchasing.
What Is the NWEA MAP Growth Math Test?
MAP Growth Math is the mathematics assessment within the wider NWEA MAP Growth program.
Schools use it to measure:
- current mathematics achievement;
- changes in achievement between testing periods;
- performance relative to an appropriate norm group;
- possible instructional strengths;
- skills that may need additional teaching;
- readiness for more advanced content.
The test is available across kindergarten through twelfth grade. NWEA also offers course-specific mathematics assessments that schools may use for subjects such as Algebra, Geometry, and Integrated Mathematics.
The exact assessment your child receives depends on the school, grade, course, standards, and testing program.
How Does the Adaptive Format Work?
MAP Math is computer-adaptive.
As your child responds, the testing system updates its estimate of their mathematics achievement and selects later questions accordingly.
In simplified terms:
- correct responses may lead to more difficult questions;
- incorrect responses may lead to less difficult questions;
- the difficulty continues to adjust throughout the assessment;
- the final score reflects performance across the complete response pattern.
The adaptive process is more sophisticated than moving up after every correct answer and down after every incorrect answer. The system considers item difficulty and how much information each response provides.
Your child may therefore see questions that appear unusually easy, difficult, or unfamiliar.
This does not necessarily mean that they are performing poorly. The assessment is designed to find the boundaries of what they currently understand.
Parent note:
Your child is not expected to answer every MAP Math question correctly. Seeing difficult questions is a normal part of an adaptive assessment.
Which MAP Math Test Will My Child Take?
The school assigns the assessment.
Students may encounter:
- MAP Growth Math K–2, designed for younger students;
- MAP Growth Math, covering general mathematics achievement;
- MAP Growth Math in Spanish;
- course-specific mathematics assessments;
- a version aligned with particular state or educational standards.
MAP Growth K–2 is designed to be accessible to early learners. Some questions may include audio support so that developing reading skills do not prevent students from understanding the mathematics task.
Older students generally receive more text-based and abstract questions. High school students may complete a general mathematics assessment or a course-specific assessment selected by the school.
Ask your school to confirm:
- the exact test name;
- the language of administration;
- whether it is a general or course-specific assessment;
- the testing date;
- how the result will be used.
Is MAP Math Timed?
MAP Growth is an untimed assessment.
NWEA reports that most MAP Growth tests are completed in approximately 40 to 55 minutes. Individual completion times vary, particularly across grades and subjects.
Testing time may be affected by:
- your child’s age;
- reading speed;
- the mathematics questions selected;
- use of accessibility tools;
- breaks;
- interruptions;
- the school’s testing arrangements.
Although the assessment is untimed, the school may reserve a particular class period or testing window.
Students should work carefully and steadily. They should not rush, but they should also avoid remaining on one question for an excessive amount of time.
How Many Questions Are on MAP Math?
NWEA standardized MAP Growth tests to 43 questions in 2022.
However, schools may use different products, screening assessments, course-specific tests, or updated test packages. Parents should therefore follow the current information supplied by the school.
The number of questions alone does not determine difficulty. Because MAP Math is adaptive, two students completing the same number of questions may see very different content.
Can Students Return to an Earlier Question?
Students generally cannot return to a previous question after submitting an answer.
Each response contributes to the selection of later questions. Changing an earlier answer after subsequent questions have already been selected would interfere with the adaptive sequence.
Encourage your child to:
- read the complete question;
- identify what it is asking;
- review all answer options;
- use scratch paper when permitted;
- make the best choice they can;
- submit the answer and continue.
What Question Formats May Appear?
MAP Math is delivered online and may contain several item formats.
Students may encounter:
- multiple-choice questions;
- multiple-response questions;
- drag-and-drop activities;
- matching tasks;
- questions using graphs, tables, or diagrams;
- numeric entry;
- open-response items;
- interactive or technology-enhanced questions.
The exact formats depend on the student’s assessment and grade range.
The official NWEA practice environment can help your child understand how to select, move, enter, and submit answers.
Which Topics Are Assessed on MAP Math?
The precise content depends on the standards and assessment selected by the school.
MAP Math may cover the following broad areas.
Numbers and Operations
Students may work with:
- counting;
- number recognition;
- place value;
- whole-number operations;
- factors and multiples;
- fractions;
- decimals;
- percentages;
- ratios and proportions;
- positive and negative numbers;
- rational and irrational numbers;
- exponents and radicals;
- absolute value;
- order of operations.
Operations and Algebraic Thinking
Questions may assess:
- addition and subtraction relationships;
- multiplication and division relationships;
- patterns;
- unknown values;
- numerical and algebraic expressions;
- equations and inequalities;
- variables;
- functions;
- linear relationships;
- systems of equations;
- slope.
Measurement and Data
Students may encounter:
- length;
- weight or mass;
- capacity;
- time;
- money;
- unit conversion;
- area and perimeter;
- surface area and volume;
- tables and graphs;
- mean, median, mode, and range;
- frequency tables;
- dot plots;
- histograms;
- scatter plots;
- data interpretation.
Geometry
Geometry questions may involve:
- two-dimensional and three-dimensional shapes;
- shape attributes;
- lines and angles;
- polygons;
- symmetry;
- coordinate geometry;
- area and perimeter;
- surface area and volume;
- transformations;
- congruence and similarity;
- the Pythagorean theorem.
Statistics and Probability
Older students may see questions about:
- statistical questions;
- distributions;
- measures of center;
- measures of variability;
- interquartile range;
- probability;
- sample spaces;
- two-way tables;
- probability models;
- interpreting relationships in data.
Keep in mind:
The list above does not mean that every child will see every topic. The content varies according to the assigned assessment, standards, grade, and adaptive question sequence.
What Mathematics Skills May Appear by Grade?
The following grade bands provide broad guidance only.
They should not be treated as an exact MAP Math syllabus because the adaptive assessment may present content from outside your child’s current grade.
| Grade band | Examples of skills students may encounter |
|---|---|
| Kindergarten–Grade 2 | Counting, comparing numbers, basic operations, shapes, measurement, time, money, and simple data |
| Grades 3–5 | Multi-digit operations, fractions, decimals, area, perimeter, measurement, graphs, numerical patterns, and early algebraic reasoning |
| Grades 6–8 | Ratios, proportions, percentages, rational numbers, expressions, equations, inequalities, geometry, statistics, probability, and functions |
| Grades 9–12 | Algebra, functions, geometry, advanced statistics, modelling, and course-specific mathematics |
Your child may see easier or harder material than these examples because MAP Growth measures achievement independently of grade-level boundaries.
What Is a MAP Math RIT Score?
MAP Math results are reported on the RIT scale.
RIT stands for Rasch Unit. It is a measurement scale used to describe achievement and track change over time.
A RIT score is not:
- a percentage correct;
- a classroom grade;
- a grade-equivalent score;
- an IQ score;
- a percentile;
- a pass-or-fail result.
The same RIT scale is used across grades. This allows schools to compare a student’s mathematics results across multiple testing periods.
A later increase in the RIT score generally indicates that measured mathematics achievement has increased. However, small differences should be interpreted in light of measurement uncertainty and testing conditions.
Does the RIT Score Show My Child’s Grade Level?
Not directly.
A RIT score represents a position on the MAP Growth mathematics scale. It should not automatically be translated into a statement such as “your child is working at Grade 7 level.”
A student may have different strengths within mathematics.
For example, the same child could show:
- strong geometry skills;
- average number skills;
- difficulty with fractions;
- emerging algebraic reasoning.
One overall score cannot describe every mathematics domain in detail.
Teachers may use instructional-area information and classroom evidence to build a more complete picture.
What Does the MAP Math Percentile Mean?
An achievement percentile compares your child’s result with students in the applicable norm group.
For example, a mathematics percentile of 75 means your child scored as well as or better than approximately 75% of students in that comparison group.
It does not mean that your child answered 75% of the questions correctly.
The percentile depends on factors such as:
- grade;
- subject;
- testing season;
- weeks of instruction;
- the norms used by the report.
The same RIT score may correspond to a different percentile for students in different grades or testing seasons.
What Changed With the 2025 MAP Growth Norms?
NWEA introduced updated MAP Growth achievement and growth norms in 2025.
The RIT scale remained the same. The updated norms changed the reference used to interpret scores through measures such as percentiles and typical growth.
The update reflects:
- more recent student-performance data;
- changes in student demographics;
- post-pandemic achievement patterns;
- the enhanced MAP Growth item-selection algorithm.
As a result, the same RIT score may correspond to a different percentile under the 2025 norms than under the earlier norms.
Important:
Do not compare a percentile from one report with an older percentile unless you know which norms and reporting settings were used. Ask the school whether the reports use the 2025 MAP Growth norms.
What Is a Good MAP Math Score?
There is no single MAP Math score that is good for every student.
The result must be interpreted according to:
- grade;
- testing season;
- applicable norms;
- previous mathematics scores;
- observed growth;
- classroom performance;
- the school’s purpose for administering the test.
A score above the national median represents above-median achievement in the relevant comparison group. It does not guarantee advanced placement, gifted identification, admission, or future academic success.
A score below the median does not prove that your child has a learning disability or cannot succeed in mathematics.
Should Parents Use Online MAP Score Charts?
When the school permits practice, families can review TestPrep-Online MAP practice or compare options with MAP Shop. Confirm the grade or level, current pack contents, access terms, and school policy before purchasing.
Online score charts can provide general context, but they can also become outdated or be interpreted incorrectly.
Before relying on a chart, check:
- which year’s norms it uses;
- whether it covers mathematics;
- the grade;
- the testing season;
- whether it represents a mean, median, or percentile;
- whether it applies to the same test version.
The school’s current report and explanation should take priority over an unofficial score table.
What Is the Difference Between Achievement and Growth?
Achievement and growth describe different parts of your child’s performance.
Achievement
Achievement shows where your child’s measured mathematics performance is at one point in time.
It may be described through:
- a RIT score;
- an achievement percentile;
- comparisons with a norm group.
Growth
Growth shows how the result changed between two comparable testing periods.
A child can have:
- high achievement and high growth;
- high achievement and lower growth;
- lower achievement and high growth;
- lower achievement and lower growth.
A student who starts below the national average can make strong growth without immediately reaching the average.
Similarly, a student with a high score can continue learning even when their percentile remains relatively stable.
Can MAP Math Identify Gifted Students?
Some schools use MAP Math as one source of information during gifted or advanced-program screening.
A school or district may consider:
- mathematics percentiles;
- repeated MAP Growth results;
- classroom performance;
- teacher recommendations;
- cognitive assessments;
- other subject scores;
- portfolios or additional evidence.
There is no universal MAP Math score that automatically qualifies a student for a gifted program.
Always consult the current criteria used by your child’s school or district.
Can MAP Math Diagnose a Learning Disability?
No.
MAP Math may identify patterns or areas where a student needs further support, but it is not a medical, psychological, or special-education diagnosis.
A formal evaluation may require:
- several assessments;
- classroom evidence;
- intervention data;
- developmental or educational history;
- professional observation;
- specialist evaluation.
Parents who are concerned about persistent mathematics difficulties should discuss them with the teacher or appropriate school professional.
Can Students Use a Calculator?
Some MAP Math questions provide an on-screen calculator when calculator use is appropriate.
The calculator may not appear on every question.
Students should not bring or use their own calculator unless the school specifically permits it.
When no calculator is provided, the item is generally intended to be answered using mental mathematics, scratch work, estimation, or another non-calculator method.
Can Students Use Scratch Paper?
Schools may provide scratch paper and a pencil for MAP Math.
Scratch paper can be useful for:
- writing intermediate calculations;
- drawing diagrams;
- organising multi-step problems;
- checking place value;
- eliminating answer options.
Your child should follow the instructions provided by the test proctor.
What Is Rapid Guessing?
MAP Growth can identify responses submitted too quickly for meaningful engagement with the question.
Rapid guessing is not simply choosing an incorrect answer. It refers to answering so quickly that the student is unlikely to have read and considered the item properly.
Repeated rapid guessing can:
- lower the score;
- make the result less accurate;
- affect growth comparisons;
- cause the school to question the validity of the result;
- lead the proctor to intervene.
Encourage your child to work carefully rather than trying to finish first.
Free MAP Math Practice Questions
The questions below are independently created examples. They are organized by grade to make the page easier to use, but they are not officially calibrated to MAP Growth grades or RIT ranges.
Non-official question disclaimer:
These are not official NWEA questions. They were created to demonstrate mathematics skills and online question formats that students may encounter. They cannot reproduce the official item bank, adaptive algorithm, difficulty calibration, scoring system, or testing conditions.
Kindergarten MAP Math Practice
Question 1: Identifying a Solid Shape
Choose the sphere from the four shapes.
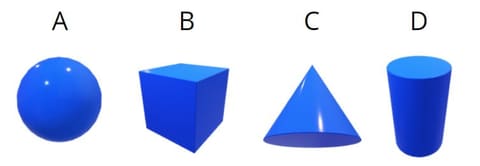
The correct answer is A.
A sphere is a three-dimensional shape that is round in every direction. A ball is a familiar example.
For similar questions, encourage your child to compare whether each shape is flat or solid and whether it has faces, edges, or corners.
Question 2: Sorting Objects
Move the sleeping cats to the box labelled “sleeping cats” and the sitting cats to the box labelled “sitting cats.”

Answer:
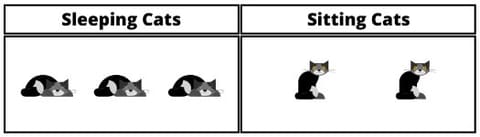
The cats must be grouped according to the action shown in the picture.
For similar questions, identify the rule for each group before moving any object.
First Grade MAP Math Practice
Question 3: Addition Within 10
Ben has 3 apples. His sister gives him 2 more apples. How many apples does Ben have altogether?
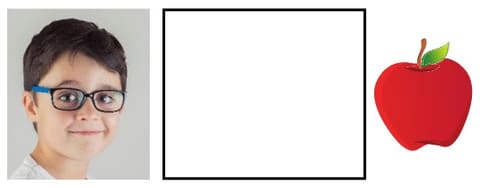
The correct answer is 5 apples.
Start with 3 and add 2:
3 + 2 = 5
Your child can count on from 3: 4, 5.
Question 4: Subtraction Within 10
There are 6 cupcakes. Putting an X on a cupcake means that it is taken away. Mark the picture to show 6 take away 2.

Answer:

Two cupcakes are removed, leaving four:
6 − 2 = 4
For similar questions, count the complete group first, remove the stated number, and then count what remains.
Second Grade MAP Math Practice
Question 5: Classifying Shapes
Look at the shapes below. Which shapes belong to the target category?
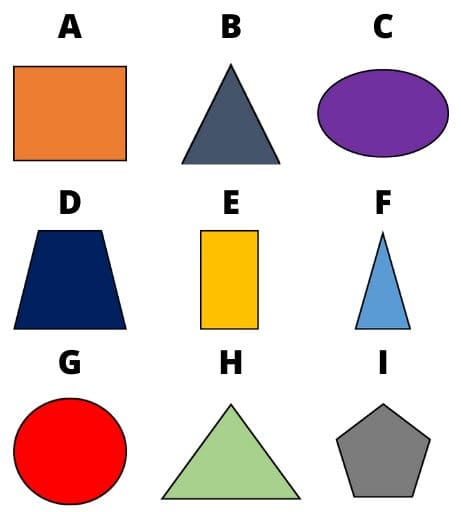
The correct answers are B, F, and H.
These shapes share the characteristic shown by the target category.
For similar questions, compare the number of sides, side lengths, corners, and whether the shape is open or closed.
Question 6: Subtraction in Context
Lucy has 4 pencils. She gives 2 pencils to her friend. Move the correct number of pencils into the box to show how many Lucy has left.
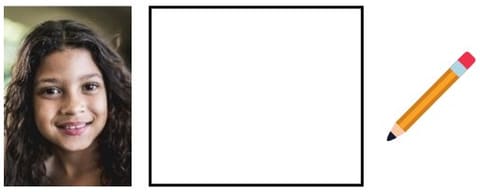
Answer:
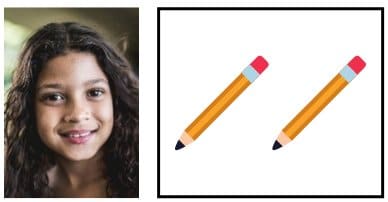
Lucy has 2 pencils left:
4 − 2 = 2
The words “gives away” show that the amount decreases.
Third Grade MAP Math Practice
Question 7: Counting a Visual Group
What is the total number of circles?
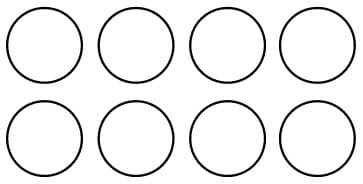
Write your answer: ____
The correct answer is 8.
There are eight circles in the complete group.
For a larger collection, count in rows, columns, or smaller groups to avoid counting the same object twice.
Question 8: Reading a Data Table
How many students chose baseball as their favourite sport?
| Sport | Number of votes |
|---|---|
| Football | 8 |
| Soccer | 10 |
| Baseball | 6 |
| Badminton | 12 |
A. 8
B. 10
C. 6
D. 12
The correct answer is C - 6.
Find the row labelled “Baseball” and read the value in the “Number of votes” column.
For similar questions, identify the correct row and column before reading the value.
Fourth Grade MAP Math Practice
Question 9: Finding Change
Kelly buys a lollipop for 53 cents and pays with a one-dollar bill.
Which picture shows the correct change?
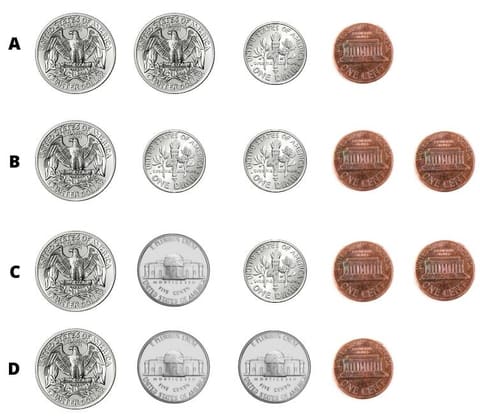
The correct change is 47 cents.
One dollar equals 100 cents:
100 − 53 = 47
The correct picture must show coins with a total value of 47 cents.

Question 10: Adding Money
Jane buys a pack of gum for 83 cents and an eraser for 12 cents. How much does she pay altogether?
A. 87¢
B. 89¢
C. 92¢
D. 95¢
The correct answer is D - 95¢.
Add the two prices:
83 + 12 = 95
Because the total is less than 100 cents, the answer remains 95 cents rather than one dollar or more.
Fifth Grade MAP Math Practice
Question 11: Combining Unit Rates
Alice jogs 18 miles in 6 days. Erin jogs 16 miles in 8 days.
If they continue at those rates, how many miles per day do they jog altogether?
A. 2 miles per day
B. 3 miles per day
C. 4 miles per day
D. 5 miles per day
The correct answer is D - 5 miles per day.
First find each person’s daily rate:
- Alice: 18 ÷ 6 = 3 miles per day
- Erin: 16 ÷ 8 = 2 miles per day
Then combine the rates:
3 + 2 = 5 miles per day
Question 12: Elapsed Time
Kevin begins his homework at 6:35 PM. He works for 45 minutes.
What time does he finish?
A. 7:10 PM
B. 7:20 PM
C. 7:25 PM
D. 8:20 PM
The correct answer is B - 7:20 PM.
From 6:35 PM to 7:00 PM is 25 minutes. Another 20 minutes reaches 7:20 PM.
The total elapsed time is:
25 + 20 = 45 minutes
For similar questions, divide the interval at the next full hour.
Sixth Grade MAP Math Practice
Question 13: Average Speed
Kevin drives for 1 hour at 45 miles per hour. He then drives for 2 hours at 30 miles per hour.
What is his average speed for the complete journey?
A. 30 mph
B. 35 mph
C. 40 mph
D. 42 mph
The correct answer is B - 35 mph.
Calculate the distance travelled during each part:
- first part: 45 × 1 = 45 miles;
- second part: 30 × 2 = 60 miles.
The total distance is 105 miles, and the total time is 3 hours:
105 ÷ 3 = 35 mph
Do not find the average by simply adding 45 and 30 and dividing by 2 because the two speeds were maintained for different lengths of time.
Question 14: Comparing Volumes
One aquarium measures 20 inches by 10 inches by 12 inches.
A second aquarium measures 20 inches by 8 inches by 15 inches.
Which property is the same for both aquariums?
A. Height
B. Perimeter
C. Volume
D. Surface area
The correct answer is C - volume.
Calculate the volume of each rectangular prism:
- first aquarium: 20 × 10 × 12 = 2,400 cubic inches;
- second aquarium: 20 × 8 × 15 = 2,400 cubic inches.
The dimensions are different, but the volumes are equal.
Seventh Grade MAP Math Practice
Question 15: Multi-Step Time Problem
Kate’s guitar lesson is scheduled for 2:45 PM. The teacher begins 7 minutes late. The lesson lasts 45 minutes, and Kate then takes 11 minutes to walk home.
What time does Kate arrive home?
A. 3:37 PM
B. 3:43 PM
C. 3:48 PM
D. 3:59 PM
The correct answer is C - 3:48 PM.
The lesson begins at:
2:45 PM + 7 minutes = 2:52 PM
It ends 45 minutes later:
2:52 PM + 45 minutes = 3:37 PM
Kate then walks for 11 minutes:
3:37 PM + 11 minutes = 3:48 PM
Question 16: Finding a Rectangle Dimension
The area of the rectangle is 85.8 square inches.
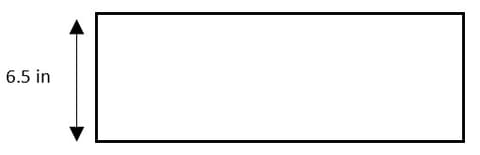
What is the width of the rectangle?
A. 13.1 inches
B. 13.2 inches
C. 13.3 inches
D. 13.4 inches
The correct answer is B - 13.2 inches.
The diagram gives a length of 6.5 inches.
For a rectangle:
Area = length × width
Therefore:
Width = 85.8 ÷ 6.5 = 13.2 inches
Check the answer by multiplying:
6.5 × 13.2 = 85.8
Eighth Grade MAP Math Practice
Question 17: Writing an Inequality
Annie drinks at most 3 cups of coffee per day.
Which inequality represents the number of cups, (c), that Annie drinks?
A. (c < 3)
B. (c > 3)
C. (c \leq 3)
D. (c \geq 3)
The correct answer is C - (c \leq 3).
“At most 3” means that 3 is allowed, but no number greater than 3 is allowed.
Therefore, the value must be less than or equal to 3.
Question 18: Area and Diameter of a Circle
The area of a circle is (81\pi) square inches.
What is its diameter?
A. 3 inches
B. 9 inches
C. 18 inches
D. 81 inches
The correct answer is C - 18 inches.
The area formula is:
(A = \pi r^2)
Substitute the given area:
(81\pi = \pi r^2)
Divide both sides by (\pi):
(r^2 = 81)
Therefore:
(r = 9)
The diameter is twice the radius:
(2 \times 9 = 18) inches
How Should Your Child Approach MAP Math Questions?
Identify the question
Before calculating, your child should decide exactly what the question asks them to find.
They should look for words such as:
- total;
- difference;
- altogether;
- remaining;
- per;
- average;
- area;
- perimeter;
- volume;
- probability.
Estimate first
Estimation can help identify an unreasonable answer.
For example, if a product should be close to 600, an answer of 60 or 6,000 may indicate a place-value error.
Show intermediate steps
Writing each step can reduce errors in:
- long division;
- fraction operations;
- multi-step word problems;
- equations;
- area and volume;
- data interpretation.
Check units
An answer may require:
- inches;
- square inches;
- cubic inches;
- miles per hour;
- dollars;
- percentages.
A calculation can be numerically correct but incomplete when the unit is missing or incorrect.
Review all answer choices
Students should not select the first answer that appears plausible.
Wrong options may represent common mistakes, such as:
- adding instead of subtracting;
- using radius instead of diameter;
- forgetting one step;
- misreading a table;
- applying an operation in the wrong order.
How Can Parents Help With MAP Math?
Use mathematics in daily life
You can practise naturally through:
- comparing prices;
- measuring ingredients;
- calculating change;
- reading a timetable;
- estimating distances;
- interpreting sports statistics;
- measuring rooms;
- comparing discounts.
Strengthen foundations
Difficulty with advanced topics may come from an earlier skill gap.
For example:
- fraction equations require fraction understanding;
- algebra requires reliable operations;
- percentages depend on decimals and fractions;
- geometry often depends on multiplication and measurement.
Ask your child to explain
Instead of asking only for the answer, ask:
- How did you start?
- Which information was important?
- Why did you choose that operation?
- How can you check the result?
- Is there another method?
Explaining the process can reveal misunderstandings that a correct answer alone may hide.
Review mistakes calmly
An incorrect answer is useful when it helps identify:
- a missing skill;
- a misunderstood word;
- a calculation error;
- an overlooked detail;
- rushing;
- uncertainty about the online format.
Avoid presenting one difficult question as evidence that your child is “bad at maths.”
How Should Students Prepare for MAP Math?
Effective preparation should focus on relevant skills and familiarity rather than attempting to memorize supposed test questions.
Confirm the assessment
Ask the school which MAP Math assessment your child will take.
Use the official practice environment
The official practice site helps students understand navigation and online tools.
It does not generate an official RIT score and is not a full adaptive content-preparation program.
Review grade-appropriate skills
Begin with skills your child is expected to encounter in class.
When a foundational weakness becomes clear, review that skill before moving to more advanced questions.
Include several question formats
Practice may include:
- multiple choice;
- numeric entry;
- tables and graphs;
- drag-and-drop activities;
- multi-step word problems.
Keep sessions manageable
Short and regular sessions are generally more appropriate than one long session immediately before the assessment.
Stop when your child becomes tired or frustrated.
Avoid speed practice
MAP Growth is untimed. The goal is careful engagement, not answering as many questions as possible in a fixed period.
Explore complete MAP Math practice:
Families who want additional grade-based exercises can review the current TestPrep-Online MAP practice resources. Confirm the grade levels, current pack contents, access period, and provider terms before purchasing.
Practice cannot guarantee a RIT score, percentile, growth result, course placement, gifted-program decision, or other educational outcome.
MAP Math Test-Day Tips
Encourage your child to:
- read the complete question;
- work carefully without rushing;
- expect some difficult questions;
- use scratch paper when provided;
- use an on-screen calculator only when it appears;
- check units;
- make the best choice and continue when unsure;
- avoid clicking quickly through unfamiliar questions.
Before the assessment:
- maintain a normal sleep routine;
- provide an appropriate meal;
- avoid intensive last-minute practice;
- make sure glasses or other approved equipment are available;
- follow the school’s instructions.
What Should Parents Ask After Receiving the Results?
Consider asking the teacher:
- Which MAP Math assessment did my child complete?
- Which norms were used?
- What does the RIT score mean in this report?
- What is the achievement percentile?
- How much growth occurred?
- Was rapid guessing detected?
- Does the result match classroom performance?
- Which mathematics areas are relative strengths?
- Which skills need additional instruction?
- How will the school respond to the results?
- When will the next MAP Growth assessment take place?
The school can explain how MAP Math connects with its curriculum and local decisions.
Frequently Asked Questions
Is MAP Math adaptive?
Yes. The assessment selects questions according to its current estimate of the student’s mathematics achievement.
Is MAP Math timed?
MAP Growth is untimed. Most assessments are completed in approximately 40 to 55 minutes, although individual times vary.
How many questions are on MAP Math?
NWEA standardized MAP Growth tests to 43 questions in 2022. The exact assessment and current school configuration should still be confirmed locally.
What grades take MAP Math?
MAP Growth Mathematics is available across kindergarten through twelfth grade. Schools may also use course-specific mathematics tests.
Is MAP Growth K–2 different?
MAP Growth K–2 is designed for younger students and may provide audio support for questions and instructions.
Can students use a calculator?
An on-screen calculator may appear on questions where calculator use is appropriate. Students should not use an external calculator unless the school permits it.
Can students go back to an earlier answer?
Students generally cannot return to an earlier question after submitting an answer because the assessment adapts using each response.
What is a MAP Math RIT score?
A RIT score is a scale score that represents measured mathematics achievement and can be used to track change over time.
Is the RIT score a percentage?
No. It is not the percentage of questions answered correctly.
What is a good MAP Math score?
There is no universal good score. The result depends on grade, testing season, norms, previous achievement, growth, and the school’s purpose.
Can MAP Math determine a child’s grade level?
Not directly. A RIT score represents achievement on the MAP Growth scale and should not be treated as a simple grade-equivalent result.
Can these practice questions produce a RIT score?
No. Only a valid official MAP Growth administration can produce an official RIT score.
Are the questions on this page official?
No. They are independently created examples intended to explain skills and question formats.
Does a difficult question mean that my child is failing?
No. Difficult questions are a normal feature of an adaptive assessment.
MAP Growth practice and guides
Start with the MAP Growth practice hub, then explore MAP Math, MAP Reading and MAP Language Usage. MAP is sometimes used alongside gifted screening — see the parent guide and score explanations. Optional practice: TestPrep-Online MAP practice, MAP Shop and TestPrep-Online Family Membership.
Related MAP Growth Guides
- Read the complete NWEA MAP Growth guide
- Explore MAP Growth Reading
- Learn about MAP Growth Language Usage
- Understand Renaissance Star Assessments
- Read the i-Ready assessment guide
Tests.School is an independent educational website. It is not affiliated with, endorsed by, or part of NWEA or HMH. MAP Growth products, norms, reports, and school policies may change. Always follow the current instructions provided by your child’s school and the official assessment provider.